Financial decision-making is an integral part of both personal and professional life. Whether you are a seasoned investor, a financial analyst, an entrepreneur, or simply someone interested in managing your personal finances, understanding the key finance equations to read efficiently a balance sheet, is determining to make informed financial decisions. These equations are essential tools that can be used to calculate returns, estimate risks, compare investment options, forecast future positive cash flows, and evaluate the financial viability of business ideas. In this article, we will discuss the 10 most important finance equations that everyone should know, their applications, and how they can be interpreted to help you make informed financial decisions and the reading of the balance sheet.
These equations have been widely used in the financial industry for decades and continue to play a significant role in financial modeling and analysis. Understanding the fundamental principles of simple and compound interest can enhance your financial decision-making, potentially saving you substantial amounts of money and significantly increasing your net worth in the long run. Whether you are looking to invest in the stock market, start a new business, or plan for your retirement, these equations can provide valuable insights that can help you achieve your financial goals.
Finance is all about formulas and indicators. And when we talk about formulas, we are not far from talking about equations. For an entrepreneur or even an experienced business owner, this can be a difficult and daunting task. With the Finotor team, we have chosen to propose a list of the 10 most commonly used financial equations to help simplify and streamline the financial management of a company and to interpret your balance sheet.
Introduction to Financial Equations
Understanding the Basics
Financial equations are essential tools for making informed financial decisions, evaluating investment opportunities, and assessing the overall health of a company. These equations provide a framework for understanding complex financial concepts and allow individuals and businesses to analyze their financial situation accurately. By mastering these equations, you can reduce financial risk, increase profitability, and make better financial decisions.
At their core, financial equations help quantify various aspects of financial performance, such as profitability, liquidity, and solvency. They are used by investors, analysts, and business owners to evaluate the viability of investments, compare different financial options, and forecast future cash flows. In this section, we will introduce the basics of financial equations and provide an overview of the key concepts and formulas used in finance.
Try Finotor for Free : > I Want Try now!
10 most important Finance Equations :
Here are the 10 financial equations to learn and use as soon as possible:
1- The Compound interest
What is the formula?
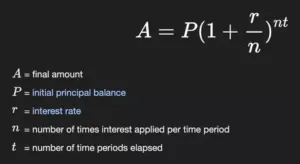
The Compound interest formula is: FV = PV x (1 + r)^n
Where:
FV = Future value of the investment
PV = Present value of the investment
r = Annual interest rate
n = Number of compounding periods
What does it measure?
The Compound interest formula is used to calculate the growth of an investment that earns interest on both the principal amount and the accumulated interest. It measures the future value of an investment after compounding the interest at regular intervals. The formula shows how interest can add up over time and how the total return on an investment can increase exponentially.
Why is this financial equation so important?
This financial equation is important because it helps investors and borrowers understand the potential growth or cost of their investments or loans. It also allows them to compare investment options that may compound at different rates or intervals. The Compound interest formula is used by financial institutions to calculate the interest on loans and by investors to calculate the future value of their investments.
One important topic is the net incomre : Net income indicates the gap between your revenue and expenses. It is also referred to as net profit, net earnings, or the bottom line of your business. When net income is negative, it is termed a net loss. Naturally, no one desires a negative net income, as it signifies that your expenses exceed your revenue. However, when launching a business, experiencing negative net income is typical until you reach your break-even point, which is another important accounting concept we will discuss later.
How can it be interpreted?
The formula can be interpreted as follows: For a given investment with a principal amount (PV), an interest rate (r), and a number of compounding periods (n), the future value (FV) can be calculated by multiplying the principal amount by the factor (1 + r)^n. The result is the total amount of money that the investment will be worth in the future after compounding the interest.
The longer the investment is held and the higher the interest rate, the greater the future value will be. By separating out the interest payments in each period, we can then arrive at the principal payments in each period by taking the difference of PMT and IMPT. In the example below, we can see that the interest payment in year 5 is $41,844 on a 30-year loan with a 4.5% interest rate.
2- The Return on Investment (ROI)
What is the formula?
The second 10 most important Finance Equations is the Return on Investment (ROI) formula is: ROI = (Gain from Investment – Cost of Investment) / Cost of Investment 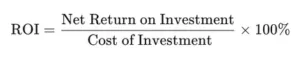 Where: Gain from Investment = Revenue – Cost of Goods Sold (COGS) – Operating Expenses Cost of Investment = Total Cost of Investment, including direct and indirect costs
What does it measure?
ROI measures the profitability of an investment by comparing the gain or return from the investment to the cost of the investment. The formula calculates the percentage return on the investment based on the initial investment cost.
Why is this financial equation so important?
The ROI formula one of 10 most important Finance Equationsbecause it helps investors and businesses assess the profitability and efficiency of their investments. By calculating ROI, investors can evaluate different investment options and determine which investments are likely to provide the highest returns. Businesses can use ROI to measure the success of a particular investment, such as a marketing campaign or a capital investment.
How can it be interpreted?
The ROI formula can be interpreted as follows: For a given investment, the ROI calculates the percentage return on the investment based on the initial investment cost. A positive ROI indicates that the investment has generated a profit, while a negative ROI indicates a loss. The higher the ROI, the more profitable the investment.
For example, if an investor invests $10,000 in a stock and sells it for $15,000, the gain from investment is $5,000.
If the cost of investment was $10,000, then the ROI would be 50% ($5,000 gain / $10,000 cost x 100%).
This means that for every dollar invested, the investor earned 50 cents in profit. In summary, the ROI formula is an important tool for evaluating the profitability and efficiency of an investment, and it can be used by investors and businesses alike to make informed financial decisions.
3- The Weighted Average Cost of Capital (WACC)
What is the formula?
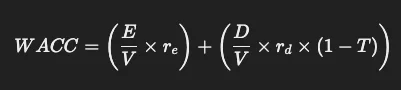
The Weighted Average Cost of Capital (WACC) formula is: WACC = (E/V x Re) + [(D/V x Rd) x (1 – T)]
Where for Weighted Average Cost of Capital (WACC):
- EE = Market value of equity
- DD = Market value of debt
- VV = Total market value of the firm’s financing (V=E+DV = E + D)
- rer_e = Cost of equity (e.g., calculated using the Capital Asset Pricing Model (CAPM))
- rdr_d = Cost of debt (typically the yield on corporate bonds)
- TT = Corporate tax rate
What does it measure?
WACC, a formula of the 10 most important Finance Equations, measures the average cost of financing a company’s assets, including both debt and equity, and the relative proportion of each source of financing. The formula calculates the expected return that a company must earn on its investments to satisfy its creditors and shareholders. The WACC formula is important because it is used to evaluate the potential return on investment for a company’s projects or investments.
The WACC represents the minimum return that a company must earn to satisfy its creditors and shareholders. If a company’s projects or investments do not meet or exceed the WACC, they are considered unprofitable and should not be pursued. The WACC formula can be interpreted as follows: For a given company, the WACC calculates the expected return on investment based on the company’s financing structure.
The WACC is a weighted average of the cost of equity and the cost of debt, taking into account the relative proportion of each source of financing. A lower WACC indicates that the company is able to finance its investments at a lower cost, which can increase profitability and attract more investors.
For example, if a company has a market value of equity of $1 million, a market value of debt of $500,000, a cost of equity of 10%, a cost of debt of 6%, and a corporate tax rate of 30%, the WACC would be calculated as follows:
WACC = (1,000,000/1,500,000 x 0.10) + [(500,000/1,500,000 x 0.06) x (1 – 0.30)]
WACC = 0.0675 or 6.75%
This means that the company’s investments must generate a return of at least 6.75% to satisfy its creditors and shareholders. If the company’s investments generate a higher return than the WACC, it indicates that the investments are profitable and may attract more investors. In summary, the WACC formula is an important tool for evaluating the cost of financing a company’s assets and determining the expected return on investment. It is used by companies to make informed financial decisions and attract investors.
If you want to know more on: Guide to the weighted average cost of capital (WACC)
4- The Capital Asset Pricing Model (CAPM)
What is the formula?
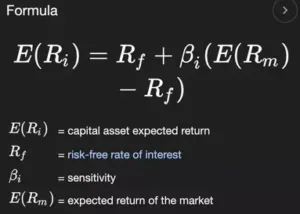
The Capital Asset Pricing Model (CAPM) formula is: r = Rf + β (Rm – Rf)
Where:
r = Expected return on an asset
Rf = Risk-free rate of return
β = Beta, which measures the asset’s risk compared to the market
Rm = Expected return on the market
What does it measure?
CAPM measures the expected return on an asset based on its level of risk, as measured by its beta, and the expected return of the overall market. The formula calculates the expected return on an asset above the risk-free rate of return. The CAPM formula is important because it is widely used in finance to determine the expected return on an asset, such as a stock or a portfolio of assets. The formula helps investors evaluate the potential risk and return of an asset and determine whether it is a good investment.
The CAPM formula can be interpreted as follows: For a given asset, the formula calculates the expected return based on the risk-free rate of return, the expected return of the market, and the asset’s beta, which measures its risk relative to the market. The expected return is the minimum return that an investor would require to invest in the asset, given its level of risk.
For example, if the risk-free rate of return is 3%, the expected return on the market is 8%, and an asset has a beta of 1.5, the expected return on the asset would be calculated as follows: r = 3% + 1.5 (8% – 3%) r = 12%
This means that the minimum expected return on the asset would be 12%, given its level of risk compared to the market. If the asset’s actual return exceeds the expected return, it indicates that the investment is profitable and has provided a higher return than expected.
In summary, the CAPM formula is an important tool for evaluating the expected return on an asset based on its level of risk and the expected return of the market. It is used by investors to determine whether an asset is a good investment and to assess the potential risk and return of their investment portfolios.
5- The Debt to Equity Ratio
What is the formula?
The Debt to Equity Ratio formula is: Debt to Equity Ratio = Total Debt / Total Equity
Where:
Total Debt = All outstanding debt of a company, including both short-term and long-term debt
Total Equity = The total value of equity of a company, including common and preferred stock. 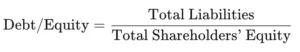 Another key ratio related to liabilities is the working capital ratio, also known as the current ratio. Similar to the quick ratio, it assesses a company’s ability to meet its short-term debts. However, unlike the quick ratio, the working capital ratio includes all current assets rather than just liquid assets, so there is no need to exclude inventory from the calculation.
What does it measure?
Debt to Equity Ratio measures the proportion of a company’s financing that comes from debt compared to equity. It is a financial metric that shows how much debt a company is using to finance its operations compared to the amount of equity it has. The Debt to Equity Ratio formula is important because it helps investors and analysts evaluate a company’s financial health and risk profile.
A high Debt to Equity Ratio indicates that a company is using more debt to finance its operations, which can increase its financial risk. On the other hand, a low Debt to Equity Ratio indicates that a company is relying more on equity financing, which may be less risky but may also limit its growth potential. The Debt to Equity Ratio can be interpreted in a few ways.
A ratio of 1 means that a company is using equal amounts of debt and equity to finance its operations. A ratio greater than 1 means that a company has more debt than equity, which can indicate higher financial risk. Conversely, a ratio less than 1 means that a company has more equity than debt, which can indicate a lower risk profile.
For example, if a company has $1 million in total debt and $2 million in total equity, its Debt to Equity Ratio would be calculated as follows:
Debt to Equity Ratio = $1 million / $2 million
Debt to Equity Ratio = 0.5
This means that the company has half as much debt as equity financing. A lower Debt to Equity Ratio is generally considered favorable because it indicates that a company has a lower financial risk profile.
However, what is considered a “good” or “bad” Debt to Equity Ratio depends on the industry and the company’s specific circumstances. So, the Debt to Equity Ratio formula is an important financial metric that helps investors and analysts evaluate a company’s financial health and risk profile. It can be used to assess a company’s capital structure, debt repayment ability, and financial risk.
6- The Price to Earnings Ratio (P/E Ratio)
What is the formula?
The Price to Earnings Ratio (P/E Ratio) formula is: P/E Ratio = Market Price per Share / Earnings per Share (EPS)
Where:
Market Price per Share = The current market price of one share of a company’s stock
Earnings per Share (EPS) = The company’s earnings divided by the total number of outstanding shares.

What does it measure?
The P/E Ratio measures the relationship between a company’s stock price and its earnings per share. It is a widely used financial metric that helps investors and analysts assess a company’s valuation and growth potential. The P/E Ratio formula is important because it provides insight into how much investors are willing to pay for each dollar of earnings.
A high P/E Ratio may indicate that investors have high expectations for a company’s future growth and earnings potential, while a low P/E Ratio may indicate that investors have lower expectations or that the company is undervalued. The P/E Ratio can be interpreted in a few ways. A high P/E Ratio may indicate that a company’s stock is overvalued relative to its earnings, while a low P/E Ratio may indicate that the stock is undervalued. However, what is considered a “high” or “low” P/E Ratio depends on the industry and the company’s specific circumstances.
For example, if a company’s stock is currently trading at $50 per share and its earnings per share are $2, its P/E Ratio would be calculated as follows:
P/E Ratio = $50 / $2
P/E Ratio = 25
This means that investors are willing to pay $25 for every dollar of earnings that the company generates.
A high P/E Ratio may indicate that investors have high expectations for the company’s future growth and earnings potential, while a low P/E Ratio may indicate that the company is undervalued. In summary, the P/E Ratio formula is an important financial metric that helps investors and analysts assess a company’s valuation and growth potential. It can be used to compare the relative valuation of companies in the same industry or to assess the attractiveness of a company’s stock as an investment opportunity.
7- The Dividend Yield
What is the formula?
The Dividend Yield formula is:
Dividend Yield = Annual Dividend per Share / Market Price per Share
Where:
Annual Dividend per Share = The total amount of dividends paid out to shareholders in a year divided by the total number of outstanding shares Market Price per Share = The current market price of one share of a company’s stock 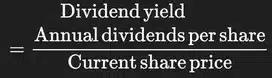
What does it measure?
The Dividend Yield measures the rate of return that investors receive from owning a company’s stock in the form of dividends. It is an important financial metric that helps investors and analysts assess the attractiveness of a company’s stock as an investment opportunity. The Dividend Yield formula is important because it provides insight into how much income investors can expect to receive from owning a company’s stock. A high Dividend Yield may indicate that the company is mature and generates consistent profits, while a low Dividend Yield may indicate that the company is focused on growth and reinvesting earnings back into the business.
The Dividend Yield can be interpreted in a few ways. A high Dividend Yield may indicate that a company’s stock is undervalued, while a low Dividend Yield may indicate that the stock is overvalued. However, what is considered a “high” or “low” Dividend Yield depends on the industry and the company’s specific circumstances.
For example, if a company’s stock is currently trading at $50 per share and its annual dividend per share is $2, its Dividend Yield would be calculated as follows:
Dividend Yield = $2 / $50
Dividend Yield = 0.04 or 4%
This means that investors can expect to receive a 4% rate of return from owning the company’s stock in the form of dividends. A high Dividend Yield may indicate that the company is mature and generates consistent profits, while a low Dividend Yield may indicate that the company is focused on growth and reinvesting earnings back into the business.
In summary, the Dividend Yield formula is an important financial metric that helps investors and analysts assess the rate of return that investors receive from owning a company’s stock in the form of dividends. It can be used to compare the relative attractiveness of dividend-paying stocks in the same industry or to assess the overall dividend policy of a company.
8- The Time Value of Money (TVM)
What is the formula?
The Time Value of Money (TVM) formula is: FV = PV x (1 + r)^n
Where:
FV = Future value of the investment
PV = Present value of the investment
r = Interest rate per period
n = Number of periods. 
What does it measure?
The TVM formula measures the value of money over time, taking into account the effects of inflation and interest rates. It is a fundamental concept in finance and investment analysis that helps investors and analysts understand the value of money invested or received at different points in time. The TVM formula is important because it allows investors and analysts to compare the value of investments that have different cash flow and time horizons.
By calculating the future value of an investment, investors can determine the rate of return needed to achieve their financial goals. The TVM formula can be interpreted in different ways, depending on the context of the investment. For example, suppose an investor deposits $1,000 in a savings account that pays 5% interest annually for five years.
Using the TVM formula, the future value of the investment can be calculated as follows: FV = $1,000 x (1 + 0.05)^5 FV = $1,276.28 This means that in five years, the investor’s $1,000 deposit will be worth $1,276.28 due to the effect of interest compounding over time. The TVM formula can also be used to calculate the present value of an investment, which represents the current value of an expected future cash flow. For example, if an investor expects to receive $1,000 five years from now, the present value of that cash flow can be calculated using the TVM formula as follows: PV = $1,000 / (1 + 0.05)^5 PV = $783.53
This means that the present value of the investor’s expected future cash flow is $783.53, given a 5% annual interest rate and a five-year time horizon. In summary, the TVM formula is a fundamental concept in finance that helps investors and analysts understand the value of money invested or received at different points in time. It is important for investment analysis, financial planning, and decision-making, and can be used to calculate the future or present value of an investment, depending on the context.
9-The Net Present Value (NPV)
What is the formula?
The Net Present Value (NPV) formula is:
NPV = PV of Cash Flow – Initial Investment
Where: PV of Cash Flow = Present value of expected cash inflows from the investment
Initial Investment = Total cost of the investment.
What does it measure?
The NPV formula measures the profitability of an investment by calculating the present value of the expected cash inflows from the investment, subtracting the initial investment, and comparing the result to zero. If the NPV is positive, the investment is considered profitable, while if the NPV is negative, the investment is considered unprofitable. The NPV formula is important because it helps investors and analysts make investment decisions based on the expected cash flow and costs associated with an investment. It takes into account the time value of money and provides a clear picture of the expected profitability of an investment, which can help investors determine whether to invest or not. The NPV formula can be interpreted in different ways, depending on the context of the investment.
For example, suppose an investor is considering investing $10,000 in a project that is expected to generate cash flow of $3,000 in year 1, $4,000 in year 2, and $5,000 in year 3.
Using the NPV formula, the net present value of the investment can be calculated as follows:
NPV = PV of Cash Flow – Initial Investment
NPV = ($3,000 / (1+ r)^1) + ($4,000 / (1+ r)^2) + ($5,000 / (1+ r)^3) – $10,000
Assuming a discount rate of 10%, the present value of the positive cash flow can be calculated as follows:
PV of positive Cash Flow = $3,000 / 1.1^1 + $4,000 / 1.1^2 + $5,000 / 1.1^3
PV of positive Cash Flow = $9,355.67
Therefore, the NPV of the investment is:
NPV = $9,355.67 – $10,000
NPV = -$644.33
This means that the investment is expected to generate negative net present value, which indicates that the investment is not profitable given the discount rate of 10%. In summary, the NPV formula is an essential concept in finance that helps investors and analysts determine the profitability of an investment by calculating the present value of expected cash inflows and subtracting the initial investment. It is important for investment analysis, capital budgeting, and decision-making, and can help investors determine whether to invest or not based on the expected profitability of an investment.
10- The Net Present Value (NPV)
What is the formula?
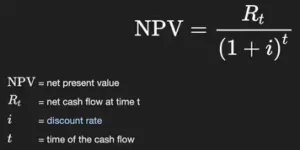
The Net Present Value (NPV) formula is: NPV = Σ (Ct / (1 + r)t) – Co
Where:
Ct = expected cash inflow in year t
r = discount rate or required rate of return
t = year of expected cash inflow
Co = initial investment.
What does it measure?
The NPV formula measures the present value of future cash inflows and outflows from a project or investment, taking into account the time value of money. A positive NPV indicates that the investment is expected to be profitable, while a negative NPV indicates that the investment is expected to be unprofitable.
The NPV formula is an essential tool for investment analysis and decision-making. It considers the time value of money, which means that a dollar received today is worth more than a dollar received in the future. By discounting future cash flows to their present value, the NPV formula provides a measure of the profitability of an investment in today’s dollars. The interpretation of NPV depends on the value of the result. A positive NPV indicates that the investment is expected to generate a return higher than the required rate of return, while a negative NPV indicates that the investment is expected to generate a return lower than the required rate of return.
A zero NPV indicates that the investment is expected to generate a return equal to the required rate of return. For example, suppose an investor is considering investing $100,000 in a project that is expected to generate cash flows of $30,000 per year for five years – so it’s not a negative cash flow.
The required rate of return is 10%. Using the NPV formula, the net present value of the investment can be calculated as follows:
NPV = Σ (Ct / (1 + r)t) – Co
NPV = ($30,000 / (1 + 0.1)^1) + ($30,000 / (1 + 0.1)^2) + ($30,000 / (1 + 0.1)^3) + ($30,000 / (1 + 0.1)^4) + ($30,000 / (1 + 0.1)^5) – $100,000
NPV = $30,000 / 1.1 + $30,000 / 1.21 + $30,000 / 1.331 + $30,000 / 1.4641 + $30,000 / 1.61051 – $100,000
NPV = $116,199 – $100,000 NPV = $16,199
The positive NPV indicates that the investment is expected to generate a return higher than the required rate of return, and therefore, the investment is profitable.
In summary, the NPV formula is an important financial equation that measures the present value of future cash inflows and outflows from a project or investment. It takes into account the time value of money and provides a measure of the profitability of an investment. It is essential for investment analysis and decision-making, and it helps investors determine whether to invest in a project or not based on the expected profitability of the investment.
Conclusion for these 10 most important Finance Equations
These 10 financial equations are essential tools for any individual or business involved in finance. Understanding them can help make better financial decisions, evaluate investment opportunities, and assess the overall health of a company. Each equation measures a specific financial metric, such as the profitability of an investment, the efficiency of a company’s operations, or the risk associated with a stock. Moreover, the interpretations of these equations provide valuable insights into the financial performance of a company or investment.
Therefore, it is decisive for individuals in finance to have a solid grasp of these 10 equations to succeed in making informed financial decisions. To go further…
To calculate Net income, also known as the bottom line, is the income remaining after subtracting all expenses and taxes from a company’s total revenue. In other words, it is the profit earned by the company over a given period. Net income is an essential financial metric because it reflects the profitability of a company, which is important for the company’s long-term survival and growth.
A high net income indicates that a company is generating significant profits and is financially stable. It means that the company’s revenues exceed its expenses, which leaves room for reinvesting in the business, paying dividends to shareholders, or paying off debts. A high net income also indicates that the company is efficiently managing its expenses and resources, which is a good sign for investors and stakeholders.
On the other hand, a low net income or negative net income indicates that a company is struggling to generate profits or is incurring significant expenses. It could be due to several factors, such as declining sales, inefficient operations, or increased competition. A low net income could signal that the company is in financial trouble and may not be able to meet its financial obligations, such as paying its debts or providing returns to investors. In summary, net income is a important financial metric for a company as it reflects its overall profitability and financial health. A high net income is desirable as it indicates a stable and successful business, while a low net income could signal financial trouble for the company.
FAQ: Mastering the 10 Most Important Finance Equations for Business Success
1. What are the 10 most important finance equations for businesses?
The 10 most important finance equations include key metrics that help businesses assess their financial health and make informed decisions. These equations cover profitability, liquidity, efficiency, and valuation.
2. Why are financial equations important for a business?
Financial equations provide valuable insights into a company’s performance. They help measure profitability, track cash flow, evaluate investment returns, and assess overall financial stability, which are critical for strategic planning and decision-making.
3. What is the formula for Return on Investment (ROI)?
The formula for ROI is:
ROI = (Net Profit / Cost of Investment) x 100
This equation helps businesses evaluate the profitability of an investment.
4. How do I calculate Gross Profit Margin?
The formula for Gross Profit Margin is:
Gross Profit Margin = (Revenue – Cost of Goods Sold) / Revenue x 100
This metric measures the percentage of revenue that exceeds the cost of goods sold (COGS), reflecting a company’s profitability.
5. What is the formula for the Debt-to-Equity Ratio?
The formula for the Debt-to-Equity Ratio is:
Debt-to-Equity Ratio = Total Liabilities / Shareholders’ Equity
This ratio indicates how much debt a company uses to finance its assets relative to the value of shareholders’ equity.
6. How do I calculate Earnings Per Share (EPS)?
The formula for EPS is:
EPS = (Net Income – Dividends on Preferred Stock) / Average Outstanding Shares
EPS helps investors assess the profitability of a company per share of stock.
7. What is the Current Ratio, and how do I calculate it?
The Current Ratio measures a company’s ability to pay off its short-term liabilities with its short-term assets. The formula is:
Current Ratio = Current Assets / Current Liabilities
A ratio greater than 1 indicates good short-term financial health.
8. How do I calculate the Price-to-Earnings (P/E) Ratio?
The formula for the P/E Ratio is:
P/E Ratio = Market Value per Share / Earnings per Share (EPS)
This ratio helps investors determine the value of a stock based on its current earnings.
9. Why is the Net Profit Margin formula important?
The Net Profit Margin formula is:
Net Profit Margin = (Net Profit / Revenue) x 100
It shows how much of the revenue a company retains as profit after all expenses are deducted, which is decisive for understanding profitability.
10. What is the formula for Inventory Turnover?
The Inventory Turnover formula is:
Inventory Turnover = Cost of Goods Sold (COGS) / Average Inventory
This equation measures how efficiently a company manages its inventory, indicating how often inventory is sold and replaced over a period.
11. How can financial equations improve business decision-making?
Using financial equations allows business owners and managers to analyze key performance indicators such as profitability, liquidity, and efficiency. This helps in making informed decisions about investments, budgeting, and financial strategies to ensure long-term success.
12. Can software like Finotor help with finance equations?
Yes, Finotor can automate the calculation of key financial equations, providing real-time insights and analytics. It simplifies complex financial analysis, allowing business owners to focus on strategy and growth without manual calculations.
13. What is the formula for Return on Equity (ROE)?
The formula for ROE is:
ROE = Net Income / Shareholders’ Equity
This equation helps determine how effectively a company is using its equity to generate profit.
14. How can I use financial ratios for forecasting?
By regularly tracking key financial ratios, businesses can identify trends and use them to forecast future performance. Ratios like ROI, Net Profit Margin, and Debt-to-Equity Ratio provide insights into growth potential and areas for improvement.